
Features Prometheus Metrics Reader
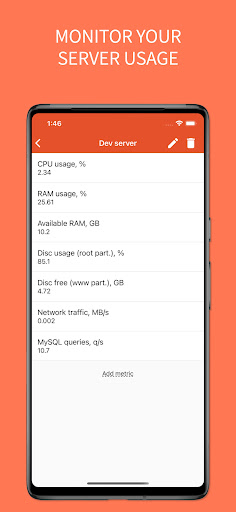
Monitor your server resource usage with Prometheus Metrics Reader.For the application to work, you need to install Prometheus on your server.
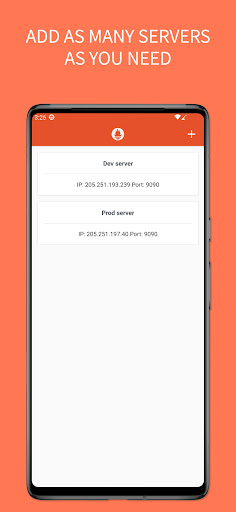
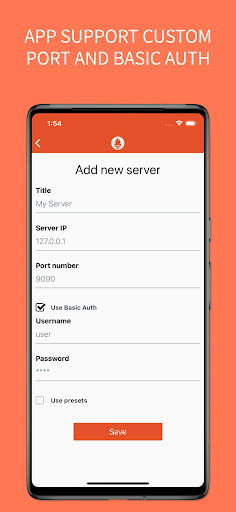
Download link - https://prometheus.io/download/- The app supports adding multiple servers.- You can use the custom server port and Basic Auth.- You can use ready-made presets.- You can add your custom metrics or edit presets.- Metrics are updated automatically when the server screen is open.You can write any query using Prometheus Queries API - https://prometheus.io/docs/prometheus/latest/querying/basics/At the moment, the application only supports single values.
Graphs and multiple values are not supported.
News & Updates
Stay informed with the latest news and updates.
Automotive
Manage and monitor your vehicle with smart features.
Offline Mode
Use the app without an internet connection. Your data syncs when you're back online.
See the Prometheus Metrics Reader in Action
Get the App Today
Available for Android 8.0 and above